Dashboard using Altair
Group Number: 23
Group Members: Aditya Khedkar Deepak Gajarmal Divyanka Phadtare Sowmya Mamidi
The World Bank Group is one of the world’s largest source of funding particularly for developing countries. The WBG is committed to eradicating poverty, sharing prosperity and promoting sustainable development. It is important to understand and analyze significant global efforts.
Digital governance is the application of modern framework technologies to improve government services. Governments at all levels are undergoing digital transformation in order to deliver government services and programs more efficiently, in a transparent manner, and cost-effectively. Today, digital government transformation has become critical for meeting the expectations of modern citizens.
The dataset was created during examination and recording of project information which was spearheaded by Integrated Digital solutions for all WBG investments. The dataset is classified as Public and comes under the Access to Information Classification Policy. Users inside as well as outside the World Bank have access to the dataset. In terms of metadata - geographical coverage ecompasses different countries around the world and includes all World Bank Group client countries. The granularity list consists of projects. In terms of temporal coverage the dataset spans from 1995 to 2022. Due to limited scope and time constraints, we are considering the Digital Government Projects Database (July 2020). The periodicity represented is annual. The Digital Government Projects Database (July 2020) dataset is basically a snapshot of operations portal data on the relevant World Bank Group funded programs within the specified period. The main source is the World Bank projects database.
The following dashboard has 4 interactive plots: 1] Bar plot showing number of total projects approved in a year. This plot is helpful to visualize the time-series instance present in the dataset.It is convenient for a user to select range of interested years through x-axis. The rest of the plots will update themselves automatically as per the user selection. 2] Stacked Bar plot showing practice showing sum of total World Bank commitment according to the project status. Each project has 1 of the following status- ACTIVE, CLOSED or PIPELINE.The graph is useful in finding out budgets allocated by World Bank according to the status of the projects for the selected years. 3] The third plot is a scatter plot showing correlation between IDA which is funds allocated by World Bank for e-governance and Net Funds allocated.It can be useful to identify any unusual behaviors in IDA funds. 4] The last plot is a pie chart showing percentages of ACTIVE,CLOSED and PIPELINE projects in given years.This plot is useful for user to priortize their focus according to the status of the project. For instance, if a number of Pipelined projects are greater than a certain threshold then summarized data associated with the projects.
Interactivity:
Each point on the scatter plot represents a location and when the user drags and drops the selected area/point from the scatter plot to the histogram, the pressure distribution of the particular area is plotted on the histogram. We understand the pressure distribution of the particular area through this interactivity.
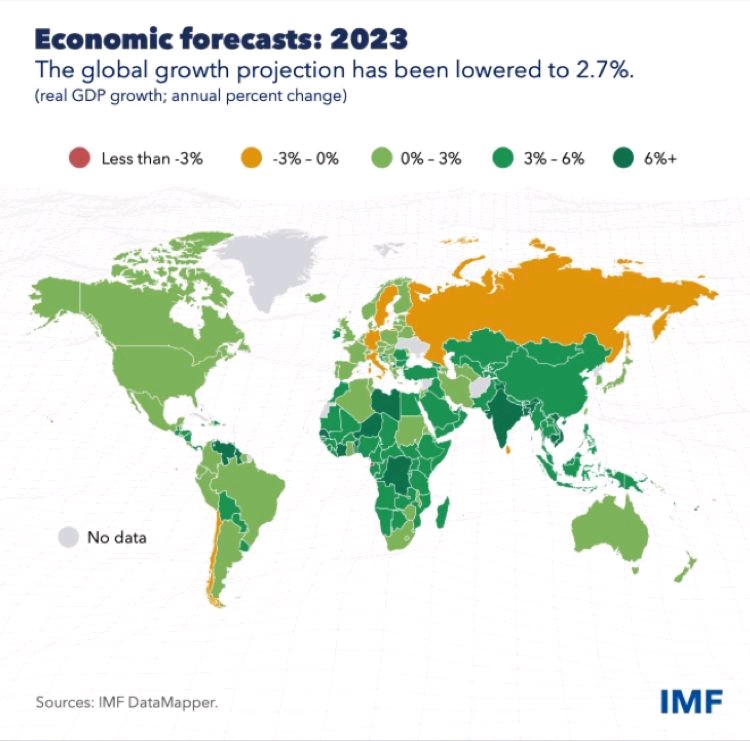
SOURCE: IMF DataMapper- https://twitter.com/AAutina/status/1589521648226430976
In these times of distress due to fear of an upcoming recession, when everything seems uncertain, what do you think it looks like, to large nations? What are the indicators of this scenario? Yes, Economic Growth is the metric used to measure it. The IMF is a trusted source of information from which we have obtained the graph shown above.
“The global growth projection has been lowered to 2.7%.” The current projection for 2022 is 3.3% and this forecast shows a significant dip in the following year! A color encoded geomap shows us the Economic forecasts for each country as a factor their growth in GDP. We can also see legends that read “Less than -3%”, “-3 to 0%”, which further helps us understand the fall in GDP percent each country is projected to experience.
From the visulaization, it is clearly understood that Russia and a few neighboring countries alongside SriLanka are likely to see “-3 to 0%” growth in GDP. United States stands next scoring a position in the “0% to 3%” growth category. India, parts of Africa show a positive growth with projections at 6%+.
Let’s watch out for what the year 2023 has in store for its countries and their people!!
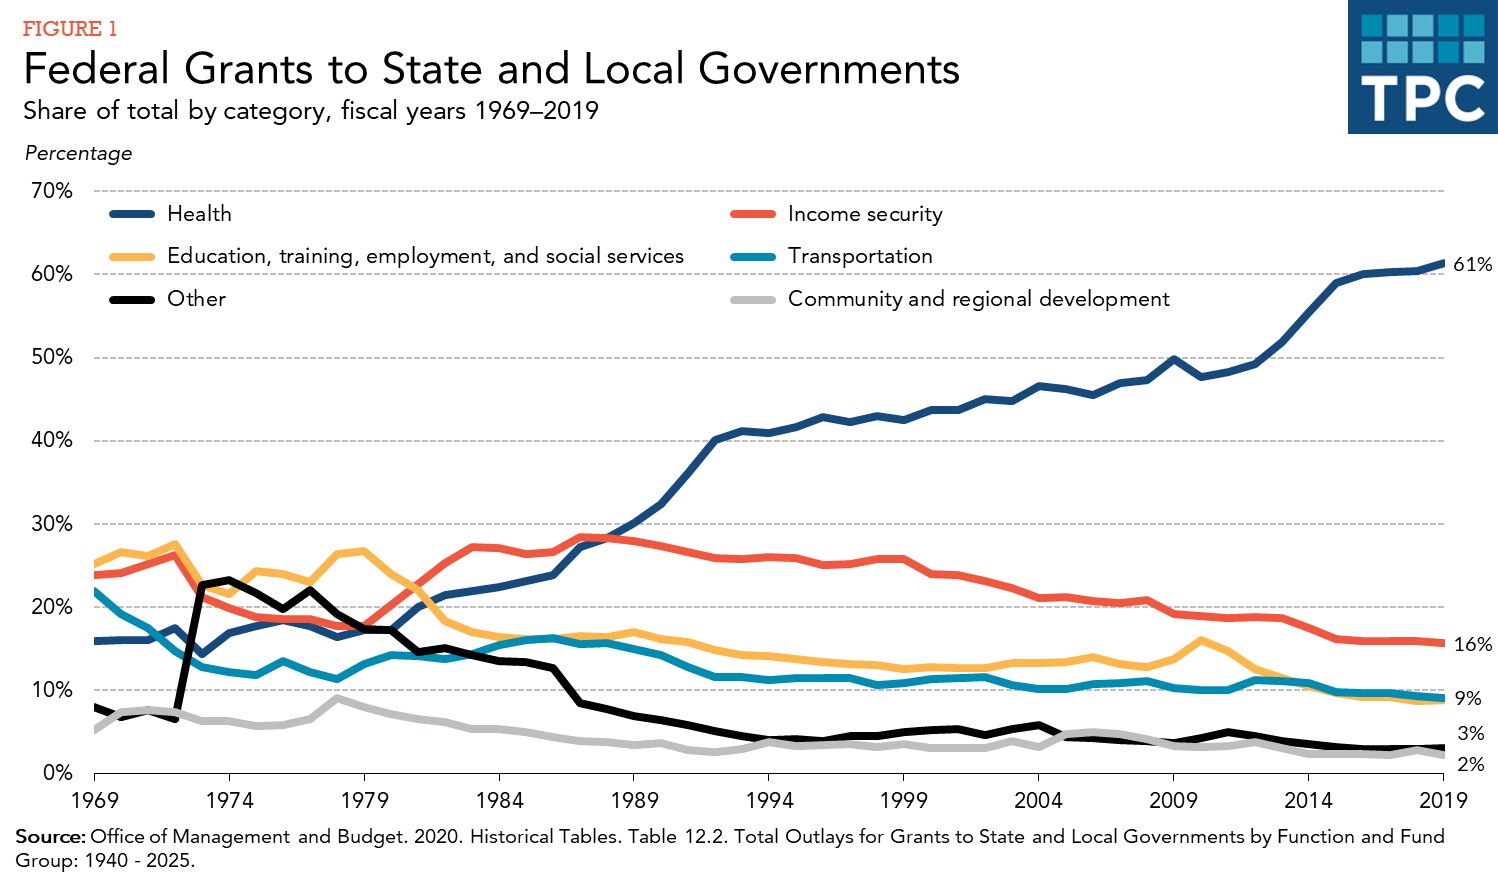
SOURCE- Tax Policy Center
The federal government distributes grants to state and local governments for several reasons. In some cases, the federal government may devolve or share responsibility for a given service or function because state and local governments have better information about local preferences and costs. In others, the federal government may offer states and localities incentives to undertake additional spending benefiting neighboring jurisdictions or the country as a whole.
The federal government distributed about $721 billion (about 16 percent of its budget) to states and localities in fiscal year 2019, providing about one-quarter of these governments’ total revenues. About 61 percent of those funds were dedicated to health care, 16 percent to income security programs, and 9 percent each to transportation and education, training, employment, and social services.
From the visualization above we can see that over the years the grants released for “Health” facilities has taken a steady rise from 16% to 61%. All other categories show a decrease in total grants over the years. Education - 26% to 9% Income Security - 24% to 16% Transportation - 21% to 9% Community and Regional Development - 5% to 2% Others- 9% to 3%